Cal/OSHA Inspections by County
Cal/OSHA enforcement is not spread evenly across California. Butte and Shasta counties see about 319 and 316 inspections per 100,000 workers a year — eight times Los Angeles, twenty times Santa Clara — driven by a referral-heavy construction enforcement pattern in the far north. All 58 counties, ranked below.
Cal/OSHA publishes no county-level enforcement statistics. This page is that breakdown — CompliantCA’s analysis of the federal enforcement data, covering the 42,309 California inspections opened from January 2020 through December 2025, mapped to counties and set against each county’s covered employment.
Free Tailgate Meeting Log. One sheet per crew safety meeting — date, topics, leader, and a print-and-sign crew list. PDF, no account. Request the log →
See the full map. Every inspection in California is on our Cal/OSHA Enforcement Map of California inspections and citations, 2020–2025 — zoom to a city, click an address, and read the citations issued there.
The rate map: enforcement runs north
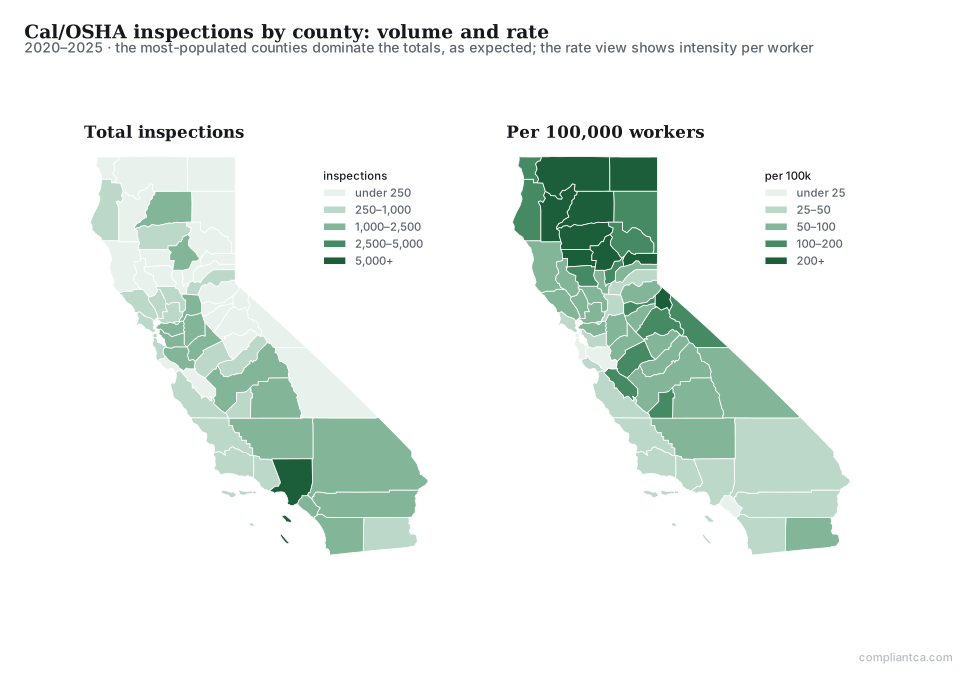
The two maps answer different questions. Total inspections follow population: Los Angeles opened 7,605 — the most of any county, and more than the bottom thirty combined. A pale county on the rate map is not a county without inspections; it is a county with many workers. The rate map answers a narrower question: where an individual workplace sees the most enforcement attention per worker — and that answer runs north.
Small counties swing on a handful of inspections — the full table below flags every county under 20,000 covered workers. Among counties above that size, the leaders:
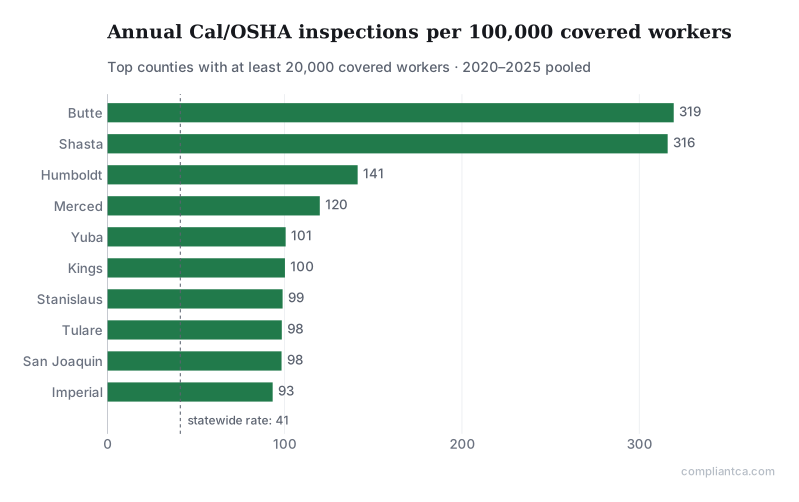
The statewide rate is about 41 annual inspections per 100,000 covered workers. The counties above it are rural and northern; the Central Valley sits near or above the average; the urban coast sits far below it — Santa Clara (16), Orange (18), San Francisco (20), San Mateo (23). Los Angeles leads every count in raw volume, 7,605 inspections, and still runs below the statewide rate per worker.
Butte and Shasta: one district office, one pattern
The two leading counties share more than a border region. Both are served by the same Cal/OSHA district office — and that office opened 48% of its inspections from referrals, four times the share of any other office in the state (the statewide referral share is 8%). Its inspections concentrate overwhelmingly in construction trades.
In Butte County, the data points at a cause it can support: the inspections center on Paradise, Magalia, Chico, and Oroville — the towns destroyed or swollen by the 2018 Camp Fire — and the counts peak in 2021–2022, the rebuilding years, then decline. A rebuild means thousands of residential construction sites, and the enforcement followed them.
In Shasta County, the same referral-and-construction signature appears, centered on Redding — but the counts are still climbing, from 90 in 2020 to 316 in 2025. The data shows the pattern; it does not name the program behind it, and we won’t guess. What an employer in the far north can take from it: referral-driven inspections arrive without a complaint or an accident, and construction is their focus.
All 58 counties
Counties marked † have fewer than 20,000 covered workers; their rates swing on a handful of inspections and should be read as rough. Sierra County’s 409, for example, rests on 14 inspections.
| County | Inspections 2020–2025 | Avg covered workers | Annual per 100k |
|---|---|---|---|
| Sierra † | 14 | 571 | 409 |
| Glenn † | 227 | 9,565 | 396 |
| Butte | 1,490 | 77,741 | 319 |
| Shasta | 1,290 | 68,035 | 316 |
| Trinity † | 48 | 2,794 | 286 |
| Tehama † | 301 | 19,375 | 259 |
| Siskiyou † | 204 | 13,854 | 245 |
| Modoc † | 34 | 2,678 | 212 |
| Alpine † | 10 | 802 | 208 |
| Plumas † | 74 | 6,388 | 193 |
| Lassen † | 104 | 9,177 | 189 |
| Del Norte † | 79 | 8,117 | 162 |
| Mono † | 72 | 7,704 | 156 |
| Colusa † | 82 | 9,193 | 149 |
| Humboldt | 421 | 49,699 | 141 |
| Tuolumne † | 128 | 17,275 | 123 |
| Merced | 594 | 82,613 | 120 |
| Amador † | 82 | 12,097 | 113 |
| San Benito † | 110 | 17,563 | 104 |
| Yuba | 122 | 20,216 | 101 |
| Kings | 296 | 49,246 | 100 |
| Stanislaus | 1,153 | 194,378 | 99 |
| Tulare | 1,005 | 170,203 | 98 |
| San Joaquin | 1,629 | 276,288 | 98 |
| Mariposa † | 33 | 5,634 | 98 |
| Imperial | 364 | 65,050 | 93 |
| Madera | 302 | 54,142 | 93 |
| Calaveras † | 56 | 10,159 | 92 |
| Yolo | 573 | 107,757 | 89 |
| Sutter | 164 | 32,336 | 85 |
| Fresno | 1,967 | 409,579 | 80 |
| Napa | 330 | 76,644 | 72 |
| Lake † | 70 | 16,674 | 70 |
| Nevada | 129 | 32,853 | 65 |
| Kern | 1,287 | 336,906 | 64 |
| El Dorado | 215 | 56,917 | 63 |
| Solano | 522 | 138,463 | 63 |
| Mendocino | 114 | 31,456 | 60 |
| Inyo † | 26 | 7,426 | 58 |
| Sonoma | 635 | 203,040 | 52 |
| Contra Costa | 1,116 | 362,804 | 51 |
| Placer | 506 | 179,475 | 47 |
| Marin | 303 | 108,413 | 47 |
| Alameda | 2,159 | 773,382 | 47 |
| San Bernardino | 2,076 | 820,056 | 42 |
| Sacramento | 1,726 | 697,773 | 41 |
| Monterey | 475 | 194,652 | 41 |
| San Luis Obispo | 283 | 117,876 | 40 |
| Riverside | 1,816 | 799,345 | 38 |
| Santa Cruz | 230 | 102,194 | 38 |
| Ventura | 684 | 325,878 | 35 |
| Los Angeles | 7,605 | 4,394,146 | 29 |
| San Diego | 2,363 | 1,483,265 | 27 |
| Santa Barbara | 331 | 212,596 | 26 |
| San Mateo | 557 | 409,785 | 23 |
| San Francisco | 834 | 706,418 | 20 |
| Orange | 1,781 | 1,610,637 | 18 |
| Santa Clara | 1,062 | 1,099,161 | 16 |
Methodology
CompliantCA computed this analysis from the U.S. Department of Labor enforcement dataset (the OSHA Information System), which includes Cal/OSHA because California operates an OSHA-approved State Plan. Scope: California inspections opened January 2020 through December 2025, as retrieved 2026-08-21.
County assignment: each inspection’s five-digit site zip is mapped to a county via the Census Bureau’s 2020 ZCTA-to-county relationship file, assigning each zip to the county holding the largest share of its land area; the roughly 1% of zips with no ZCTA (mostly PO-box zips) are assigned by their city’s majority county. Coverage: 99.9% of inspections mapped. About 6% of inspections sit in zips that cross county lines with less than 90% of land area in the dominant county; excluding them changes no finding on this page, though it can swap adjacent ranks between near-tied counties (Alameda and San Bernardino, Riverside and Orange), which is why this page reports rates and counts rather than precise ranks.
Denominators: county average covered employment 2020–2025 from the BLS Quarterly Census of Employment and Wages, all ownerships; 2025 is preliminary. Rates are annualized: inspections divided by six years, divided by average employment, times 100,000. District-office referral shares are computed from the same inspection data. The chart’s data appears in the table above it and the full table.
An inspection count says where inspectors went, not what any employer must do — the standards themselves say that.
Frequently asked questions
Which California county has the most Cal/OSHA inspections?
By raw volume, Los Angeles County — 7,605 inspections opened from 2020 through 2025, per federal enforcement data. Per worker, the picture inverts: Butte County leads among counties with at least 20,000 covered workers, at about 319 annual inspections per 100,000 workers, with Shasta County at 316.
Which counties are inspected least, per worker?
The big urban coastal counties. Santa Clara County runs about 16 annual inspections per 100,000 covered workers, Orange 18, San Francisco 20, San Mateo 23 — against a statewide rate of about 41.
Why are Butte and Shasta inspected so much?
The data shows the pattern, not the policy: both counties are served by the same Cal/OSHA district office, which opened 48% of its inspections from referrals — four times any other office in the state — overwhelmingly in construction. In Butte, the surge centers on Paradise, Magalia, Chico, and Oroville and peaks in 2021–2022, matching the rebuilding years after the 2018 Camp Fire. Shasta's counts are still climbing through 2025.