OSHA Inspections and Citations by State
From 2020 through 2025, OSHA and the states that run their own programs opened 405,165 workplace inspections and issued 741,426 citations. The attention is uneven: state-plan states inspected at 56 per 100,000 workers a year against 37 under federal OSHA, Washington out-inspected every other state, and California — the nation's largest totals — sits in the bottom third per worker.
No agency publishes a state-by-state comparison of OSHA enforcement. This page is CompliantCA’s computation from the federal enforcement data: 405,165 inspections opened and 741,426 citations issued from 2020 through 2025, across the 50 states, the District of Columbia, Puerto Rico, and the U.S. Virgin Islands, each set against its covered employment.
Where the enforcement is
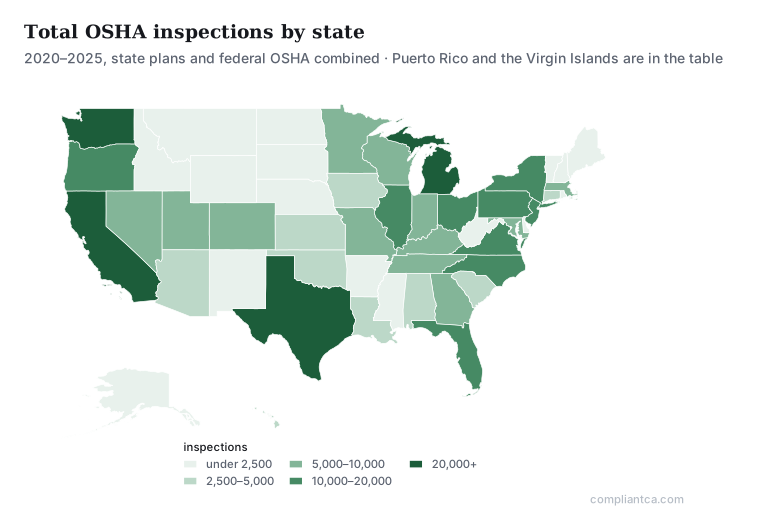
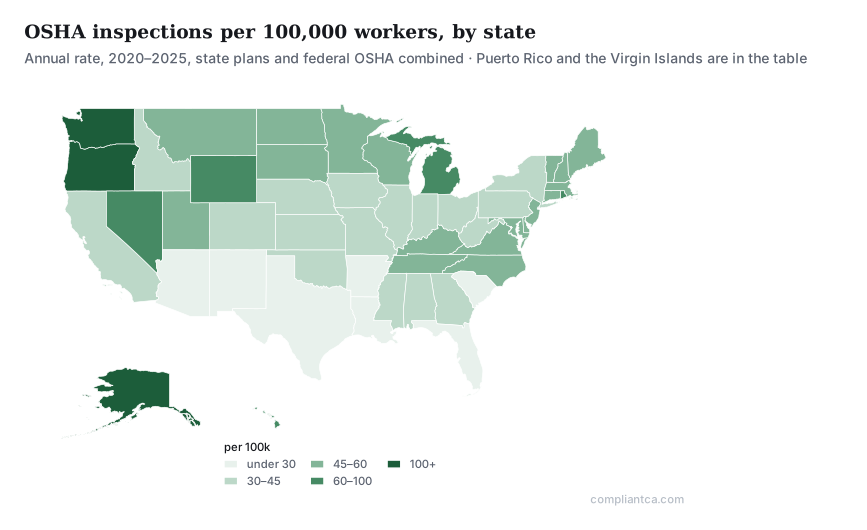
The two maps answer different questions. Total inspections follow workforce size: California opened 42,308 inspections — the most in the country — with Texas, Michigan, and New York among the leaders. The rate map corrects for workforce and shows where an individual workplace sees the most enforcement: the Pacific Northwest. Washington ran about 153 annual inspections per 100,000 covered workers, Oregon 144, and Alaska 124 — against a national rate of 45. Arizona had the lowest inspection rate of any state, at about 18 annual OSHA inspections per 100,000 covered workers from 2020 through 2025, followed by Arkansas at 19 and South Carolina at 21.
Citations follow a similar geography, with one addition:
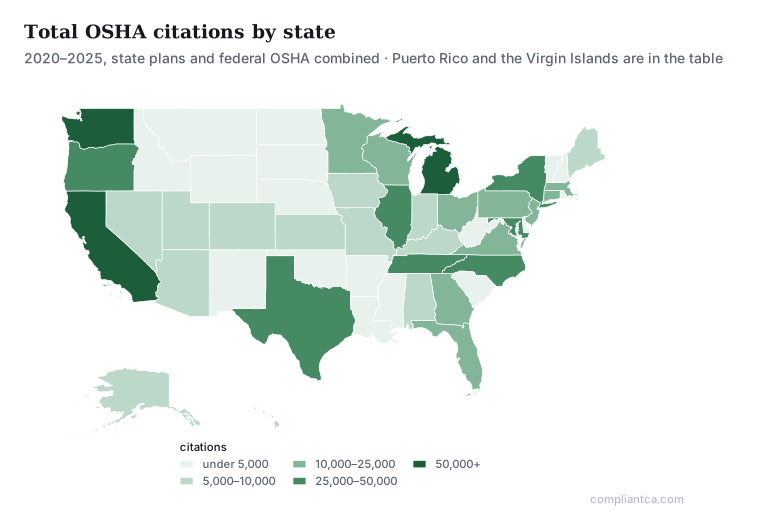
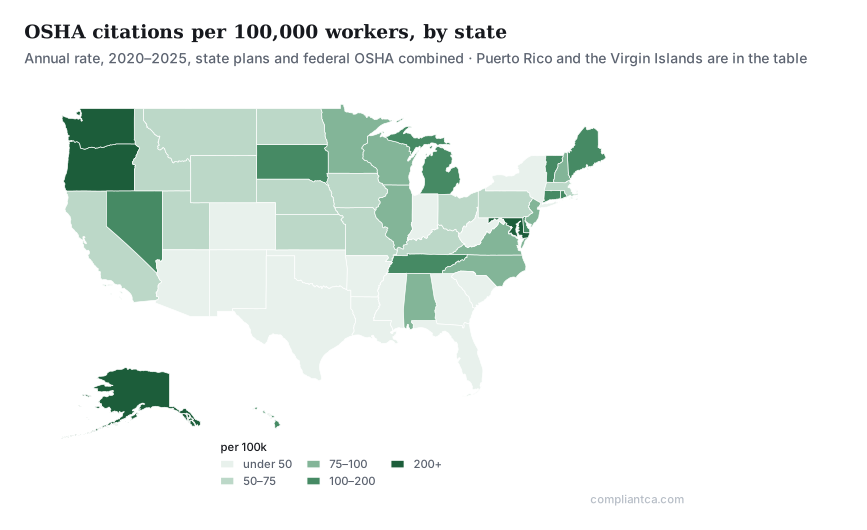
Washington issued 66,996 citations from 2020 through 2025 — second only to California’s 78,084, from about a fifth of California’s workforce. Maryland joins the citation-rate leaders at about 221 per 100,000 workers a year, on an unremarkable inspection rate — its inspections simply cite more, covered below.
States that run their own OSHA inspect more
Federal OSHA lets a state run its own enforcement program under an approved plan; 29 CFR part 1952 lists 22 full plans — 21 states plus Puerto Rico — and 7 more covering only state and local government workers. The full-plan jurisdictions enforce more, per worker, on both measures:
| Coverage, 2020–2025 | Inspections | Annual per 100k workers | Citations | Annual per 100k workers |
|---|---|---|---|---|
| Full state plans (22 jurisdictions) | 212,447 | 56 | 425,704 | 113 |
| Federal OSHA and hybrid states (31) | 192,718 | 37 | 315,722 | 60 |
Workplaces in full state-plan jurisdictions saw about 56 inspections per 100,000 covered workers a year from 2020 through 2025; workplaces under federal OSHA coverage saw 37. Citations separate further — about 113 per 100,000 workers a year against 60. A state plan is not a guarantee of intensity, though: Arizona and South Carolina run their own plans and still post the two lowest state inspection rates in the country.
California: the largest totals, a middling rate
California recorded the most OSHA inspections (42,308) and the most citations (78,084) of any state from 2020 through 2025 — and ranks 37th of these 53 jurisdictions in inspections per worker, at about 40 per 100,000 covered workers a year against the national 45. The state’s enforcement looks big because the state is big. What Cal/OSHA’s activity looks like up close — which counties, which years, what it costs, and how it differs from federal OSHA — has its own pages.
Maryland cites 4.8 times per inspection
Nationally, OSHA and state-plan inspections produced 1.8 citations per inspection over the window. Maryland produced 4.8 — 35,235 citations from 7,399 inspections — the most of any jurisdiction, followed by Tennessee (3.3), Connecticut (3.1), and Maine (3.0). At the bottom, the District of Columbia (0.8), West Virginia (0.9), and Montana (1.0) average about one citation or fewer per inspection. The data records the counts, not the enforcement philosophy behind them.
All 53 jurisdictions
Sorted by annual inspections per 100,000 covered workers. The Virgin Islands’ rates rest on about 35,000 covered workers — small enough that a modest count swing moves them. In the Program Type column, State runs its own full OSHA plan, Federal is covered by federal OSHA directly, and Hybrid runs a state plan for government workers only, with federal OSHA covering its private employers.
| Jurisdiction | Program Type | Inspections | Citations | Inspections per 100k/yr | Citations per 100k/yr |
|---|---|---|---|---|---|
| Virgin Islands | Hybrid | 638 | 1,073 | 301 | 507 |
| Washington | State | 31,873 | 66,996 | 153 | 321 |
| Oregon | State | 16,797 | 27,650 | 144 | 238 |
| Alaska | State | 2,351 | 5,236 | 124 | 275 |
| Puerto Rico | State | 5,973 | 8,853 | 109 | 162 |
| Hawaii | State | 3,183 | 6,337 | 86 | 172 |
| Michigan | State | 21,495 | 50,318 | 84 | 197 |
| Nevada | State | 6,994 | 9,025 | 80 | 103 |
| Rhode Island | Federal | 2,154 | 3,874 | 75 | 135 |
| Wyoming | State | 987 | 1,167 | 60 | 71 |
| North Dakota | Federal | 1,473 | 1,614 | 59 | 65 |
| Vermont | State | 1,059 | 2,109 | 59 | 117 |
| South Dakota | Federal | 1,489 | 3,121 | 56 | 117 |
| Virginia | State | 12,921 | 23,087 | 54 | 97 |
| Montana | Federal | 1,603 | 1,557 | 54 | 53 |
| New Hampshire | Federal | 2,111 | 3,962 | 53 | 99 |
| New Jersey | Hybrid | 12,704 | 23,105 | 52 | 94 |
| Utah | State | 5,024 | 7,313 | 51 | 74 |
| Kentucky | State | 5,796 | 7,480 | 50 | 65 |
| Connecticut | Hybrid | 4,796 | 14,953 | 49 | 152 |
| Minnesota | State | 8,336 | 14,594 | 49 | 85 |
| Wisconsin | Federal | 8,385 | 16,668 | 49 | 97 |
| Tennessee | State | 9,154 | 29,900 | 49 | 159 |
| Maine | Hybrid | 1,806 | 5,432 | 48 | 144 |
| North Carolina | State | 13,543 | 25,681 | 48 | 91 |
| Maryland | State | 7,399 | 35,235 | 46 | 221 |
| Massachusetts | Hybrid | 9,814 | 13,783 | 46 | 65 |
| Delaware | Federal | 1,256 | 3,193 | 46 | 116 |
| Kansas | Federal | 3,744 | 5,764 | 45 | 69 |
| West Virginia | Federal | 1,815 | 1,653 | 45 | 41 |
| Illinois | Hybrid | 15,722 | 34,325 | 45 | 97 |
| Iowa | State | 3,934 | 6,335 | 43 | 69 |
| Idaho | Federal | 2,040 | 2,680 | 41 | 54 |
| Pennsylvania | Federal | 14,201 | 19,185 | 41 | 55 |
| Alabama | Federal | 4,935 | 9,300 | 40 | 76 |
| Ohio | Federal | 13,025 | 24,093 | 40 | 75 |
| California | State | 42,308 | 78,084 | 40 | 74 |
| Nebraska | Federal | 2,255 | 3,542 | 38 | 60 |
| Colorado | Federal | 6,234 | 8,072 | 37 | 48 |
| New York | Hybrid | 18,192 | 27,444 | 33 | 49 |
| Indiana | State | 5,993 | 7,976 | 32 | 43 |
| Georgia | Federal | 8,898 | 12,157 | 32 | 43 |
| Oklahoma | Federal | 3,054 | 3,694 | 31 | 38 |
| Missouri | Federal | 5,244 | 8,507 | 31 | 50 |
| Mississippi | Federal | 2,066 | 2,661 | 30 | 39 |
| Texas | Federal | 22,922 | 36,038 | 29 | 45 |
| Florida | Federal | 14,962 | 17,946 | 27 | 32 |
| New Mexico | State | 1,249 | 2,457 | 25 | 49 |
| Louisiana | Federal | 2,723 | 3,124 | 24 | 28 |
| District of Columbia | Federal | 1,026 | 851 | 23 | 19 |
| South Carolina | State | 2,715 | 3,614 | 21 | 27 |
| Arkansas | Federal | 1,431 | 2,351 | 19 | 31 |
| Arizona | State | 3,363 | 6,257 | 18 | 34 |
Free IIPP Audit Checklist. The records a Cal/OSHA §3203 inspection asks for, one question about each — can you produce it today? A cite per item and a gaps table at the back. PDF, no account. Request the checklist →
Methodology
CompliantCA computed this analysis from the U.S. Department of Labor enforcement dataset (the OSHA Information System), which covers federal OSHA and every OSHA-approved State Plan; the bulk export was retrieved 2026-08-30. Inspections are counted by opening date, January 2020 through December 2025; citations by issuance date over the same window, excluding records flagged deleted in the source. A citation here is a violation line item, the dataset’s unit; an inspection can produce several. Citations-per-inspection divides the window’s citations by its inspections, so citations issued in early 2020 on 2019 inspections sit in the numerator while their inspections do not — a small mismatch at the window’s edges that does not move any figure shown. Each inspection and citation is assigned to the state where the inspected site sits, whichever agency inspected it — federal OSHA conducts some inspections inside state-plan states (maritime, federal enclaves, and other retained jurisdiction), and those count in that state’s totals.
Jurisdictions: the 50 states, the District of Columbia, Puerto Rico, and the U.S. Virgin Islands — the areas with covered-employment denominators in the BLS Quarterly Census of Employment and Wages. Guam (501 inspections), the Northern Mariana Islands (165), American Samoa (157), 22 records coded to no known state, and 3 with none at all are excluded. Denominators are each jurisdiction’s average covered employment 2020–2025, all ownerships; 2025 is preliminary. Rates are annualized: count divided by six years, divided by average employment, times 100,000. Counts come from the 2026-08-30 snapshot; our California pages computed from an earlier retrieval can differ by single records as the source amends (their 42,309 California inspections is this page’s 42,308). State-plan status is per 29 CFR part 1952, current as of 2026-08-31; in the plan-versus-federal comparison, the seven plans covering only state and local government employees — the table’s “Hybrid” states — count on the federal side, since federal OSHA covers their private sector, and Puerto Rico counts with the full plans.
One caution on reading the rates: they measure enforcement activity, not workplace safety. States differ in industry mix, in the standards their programs enforce, and in how inspections are targeted — a high rate means more inspections per worker, nothing more.
An inspection count says where inspectors went, not what any employer must do — the standards themselves say that.
Frequently asked questions
Which state has the most OSHA inspections?
California, by total volume: 42,308 inspections opened from 2020 through 2025, per federal enforcement data. Per worker, Washington leads the states at about 153 annual inspections per 100,000 covered workers; Texas runs 29 and Florida 27. The U.S. Virgin Islands, a territory with about 35,000 covered workers, posts the highest rate of any jurisdiction at 301.
Which state issues the most OSHA citations?
California again by volume — 78,084 citations issued 2020 through 2025 — with Washington second at 66,996 despite having a fifth of California's workforce. Per worker, Washington leads the states at about 321 annual citations per 100,000 covered workers. Maryland issues the most citations per inspection: 4.8, against a national average of 1.8.
Do state-plan states inspect more than federal OSHA?
Yes. The 22 jurisdictions running full OSHA-approved state plans inspected at about 56 per 100,000 covered workers a year from 2020 through 2025; the states covered by federal OSHA ran at 37. Citations separate further: about 113 per 100,000 workers a year under full state plans against 60 under federal coverage, per federal enforcement data.
Which states run their own OSHA programs?
Per 29 CFR 1952, twenty-one states and Puerto Rico run OSHA-approved plans covering private and government employers: Alaska, Arizona, California, Hawaii, Indiana, Iowa, Kentucky, Maryland, Michigan, Minnesota, Nevada, New Mexico, North Carolina, Oregon, South Carolina, Tennessee, Utah, Vermont, Virginia, Washington, Wyoming, and Puerto Rico. Seven more plans cover state and local government workers only: Connecticut, Illinois, Maine, Massachusetts, New Jersey, New York, and the U.S. Virgin Islands.
Which states have the fewest OSHA inspections per worker?
Arizona, at about 18 annual inspections per 100,000 covered workers 2020–2025 — the lowest of any state despite running its own state plan — then Arkansas at 19 and South Carolina at 21. Washington, D.C. runs at 23.